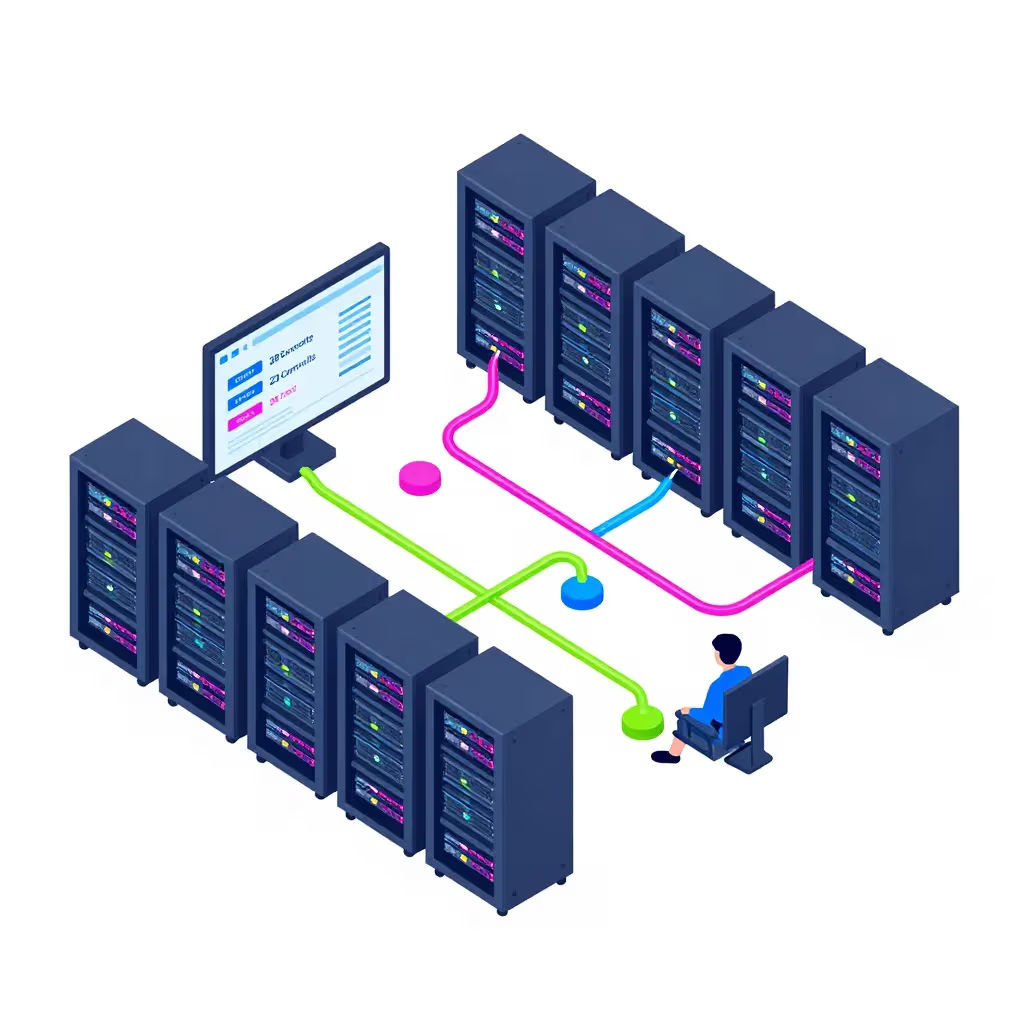
For most of Poindexter’s life, we didn’t really have a UI. We had a stack of adjacent tools: Grafana dashboards for metrics, a Discord bot and a Telegram bridge for alerts, a CLI for day-to-day operations, and a handful of MCP servers doing the actual work underneath. That’s a perfectly normal way to run an AI-operated pipeline. It’s also a sign that nobody has committed to a real interface yet.
We’ve spent the last few sprints changing that. The short version: we built a console, decided it would be our primary UI going forward, and are in the process of replacing the Grafana-in-an-iframe pattern with native panels that live inside our own application. This post is about why we made that call, how we’re sequencing it, and what “native” actually means once you get past the buzzword.
The problem with dashboards bolted onto a tool

Grafana is good at Grafana. It’s not good at being your product. When your primary operational surface is a dashboard embedded in a page, you inherit its rendering model, its auth quirks, its refresh cadence, and its opinions about layout – none of which were designed around your workflow.
We noticed this the hard way. Observability, Discord/Telegram alerting, the CLI, and the MCP servers had all grown up as separate side-channels rather than parts of one coherent system. When we finally asked where UI/UX actually lived in our architecture, the honest answer was: nowhere. It was scattered across tools that happened to be adjacent to each other.
That’s the same failure mode the industry has been circling for a while. The Zebkit team’s writeup on custom vs. native UI components makes the point plainly: native components integrate more tightly with the platform’s own rendering and interaction model, while cross-platform or embedded approaches trade that tightness away for convenience. A dashboard-in-a-frame is convenience. It’s not integration.
The decision: console as primary, Grafana as fallback
Once we framed it that way, the fix wasn’t “add more panels to Grafana.” It was “build a real UI and demote Grafana to the tool you reach for when you need to dig deeper.” We committed to that explicitly: the console becomes the thing we trust to run the business day to day, and Grafana stays available for the cases where you genuinely want its query flexibility.
That commitment changes the bar for the console. A prototype dashboard can be flaky and nobody loses sleep over it. A primary UI can’t be flaky: if it’s silently wrong, or silently down, that’s now a real operational problem, not a cosmetic one. So we didn’t treat this as a UI polish task – we treated it as a program that needed a proper plan, not just picking a fix and shipping it.
This mirrors a broader pattern outside our own stack, too. OneNorth’s writeup on the mobile platform shift points out that Apple and Google’s latest platform updates aren’t just feature releases – they’re pushing brands to lean on native capabilities instead of generic cross-platform shells. Same instinct, different domain: once you’re serious about an interface, you stop treating the platform’s native primitives as optional.
Decomposing “native everything”
“Console as primary UI, native everything” sounds like one project. It isn’t. It’s several independent subsystems, and trying to build them all at once is how these efforts stall out.
We broke it into a foundation phase first – reliability and trust in the basics, things like making sure the internal http() calls actually behave predictably – because none of the flashier work matters if the plumbing underneath is shaky. Only after that foundation held up did we move to the actual native migration: replacing embedded Grafana panels with native time-series views, GPU telemetry panels, and Postgres panels built directly into the console.
We tracked this as a formal program – the telemetry-tab native-migration effort, sub-projects A through E – and worked through it as a sequence rather than a big-bang rewrite. Sub-project B, the first slice of native panels, got battle-tested before we moved on to the harder pieces: time-series, GPU, and Postgres panels natively rendered instead of iframed in. That program is now complete, and the panels that used to be someone else’s dashboard are ours.
This connects directly to something we wrote about previously: the shift from native to upscaled. That piece was about a different domain – rendering – but the underlying tension is the same one. You can lean on an intermediate layer that gets you most of the way there, or you can do the harder work of building the real thing. Upscaling gets you close to native rendering quality without the cost. Embedding Grafana gets you close to a real UI without the cost. Both are legitimate tradeoffs – until the thing you’re building becomes primary. At that point, “close to native” stops being good enough, and you make the switch.
Observability isn’t a special case – it’s just another module
The architectural insight that made this tractable: observability, alerting, the CLI, and the UI aren’t exceptions to how the rest of the system is organized. They split the same way everything else does. The core owns the runtime and the contract; each surface – Discord, Telegram, CLI, console – contributes its slice through the same registration pattern the rest of the system already uses for routes and migrations.
Once we saw it that way, “build a native UI” stopped being a UI project and became an integration project. The console isn’t a separate app bolted onto Poindexter. It’s another module that happens to render panels instead of processing webhooks.
That framing also explains why we’re comfortable calling Grafana a fallback rather than ripping it out entirely. We evaluated replacing it wholesale and decided against a hard cutover – Grafana’s ad hoc query flexibility is still useful when you need to dig into something the native panels weren’t built to show. This is the same tradeoff Zebkit’s comparison draws out between native and embedded components: the tightly integrated surface wins for everyday use, but the flexible, general-purpose tool still earns its keep for the edge cases it was built for. The point isn’t to eliminate Grafana. It’s to stop depending on it for the interface you use every day.
Where this leaves us
The pattern here isn’t unique to our stack. It’s the same one that pushed React Native’s declarative model into mainstream mobile development – a shift Meta’s own React Native documentation frames explicitly as a move toward native rendering and interaction rather than a purely cross-platform abstraction – and the same one behind Apple and Google’s continued push toward native platform capabilities. Cross-platform and embedded approaches earn their keep early, when speed matters more than integration. They stop earning their keep once the interface becomes something people actually depend on.
We’re past that line now. The console is our primary UI, the native panels – time-series, GPU telemetry, and Postgres – are live, and Grafana sits one click away for when we need to dig deeper. If you’re still running your operations through a dashboard embedded in someone else’s tool, that’s fine – until it isn’t. The moment it becomes the thing you trust to run the business, native stops being a nice-to-have. That’s the line we crossed, and we’re not going back to the iframe.